Speeches Shim

Energy efficiency is a powerful strategy that emerging economies can use to secure their energy future while also pursuing prosperous and sustainable development. Learn how efficiency reduces energy consumption while creating jobs and bolstering economies.
For emerging economies that are growing rapidly, new construction and infrastructure offer a significant opening for energy efficiency efforts. By contrast, locations with low growth rates and a well-established built environment present fewer opportunities to add efficiency; changes are not impossible, but they can be expensive.
If efficiencies can be designed into new buildings and other types of infrastructure, expensive energy consumption and waste can be avoided from the beginning, as can the need for costly retrofits in the future. The greatest opportunity to maximize energy efficiency is during design, when daylighting, space configurations, and material choices are made. Many of these decisions cannot be undone by a retrofit, so choices made today may have a dramatic impact on energy demand tomorrow. Each new home, office building, and factory is an opportunity to invest long term in energy efficiency and to realize energy and cost savings.
Looking at national economies, the International Energy Agency (IEA) has estimated that since 2010, countries around the world have used less energy to produce more value. In other words, energy consumption is lower due to efficiency, while gross domestic product (GDP) has risen. The resulting good news for emerging economies that are growing is that energy efficiency is not an added expense, but instead is a tool to create a more productive marketplace.
As an example of energy policies in a high-growth economy, Indonesia used its 2014 National Energy Policy and 2017 National Energy Plan to put in place broad cross-sector energy reductions. The IEA has estimated that if Indonesia reaches its 2025 goal of 17 percent average energy savings in the industrial, transport, residential, and service sectors, it will have avoided constructing the equivalent of 20 coal-fired power stations, or an investment cost of US$10 billion.
Similarly, China’s growing economy and recent financial gains stem in part from energy efficiency improvements in its industrial sector. Across the cement, steel, and aluminum industries, energy intensity improved at rates as high as 21 percent between 2010 and 2014. During this time, energy savings across 11 industries totaled almost US$15 million. China also boosted its economy during this time by reducing energy imports. Savings from reduced imports in 2015 were lowered by US$10 billion.
Linkages Among Energy Efficiency, Jobs, and Consumer Welfare
In most cases, energy infrastructure investments create a ripple effect throughout the economy. That said, energy efficiency investments create more jobs per dollar invested than traditional energy supply investments. Efficiency also creates more jobs in the home economy, whereas energy supply jobs and investment dollars often flow outside the country into global energy markets.
Investors often tout impressive job growth projections associated with building new power generation capacity, yet even greater job growth would result from investing an equivalent amount in energy efficiency. The IEA reported that China, home of more energy service companies (ESCOs) than in any other country in 2016, employed 652,000 workers that year.
Energy efficiency creates three types of jobs, each representing an expanded level of economic impact:
Three Types of Jobs Created by Energy Efficiency
- Direct Jobs
- Direct jobs result immediately from energy efficiency investments. For example, when a firm or a government agency contracts with an energy service company to install and maintain energy-efficient technology, the ESCO then recruits and hires the needed workers. In the United States, almost half of the over 2 million jobs in energy efficiency are related to installing and maintaining efficient heating and cooling equipment.
- Indirect Jobs
- Efficiency investments also create indirect jobs in the related supply and service chains. For example, facilities that supply building materials, or that manufacture or distribute energy-efficient products, may have to create new jobs in order to meet the higher demand. Even when energy-efficient products are manufactured outside the country and imported, job growth may still occur along the supply chain as goods move from manufacturer to distributor to retailer to end user.
- Induced Jobs
- When workers hired into new direct and indirect jobs spend their income on goods and services in the local economy, induced jobs open in response. Similarly, induced jobs are created when consumers save money on energy bills and spend it on other priorities such as education, food, medicine, or nonessential items and services. Economists regularly note such “cross-elasticity” effects when energy prices fall and retail sales rise accordingly.
Energy efficiency investments have employment impacts over time as well. In the short term, money spent on energy efficiency improvements drives direct, indirect, and induced job creation in labor-intensive industries such as construction, contracting, maintenance, and engineering. In the long term, consumers recirculate the money they save through reduced energy bills, and businesses reinvest their resulting proceeds. This reinjection of capital has an economic multiplier effect, just like spending by new workers hired into direct and indirect jobs. In fact, the majority of jobs created by energy efficiency programs occur in this downstream area.
Energy Efficiency and Job Growth Example
In a suburb of Cape Town, South Africa, the Kuyasa Low-Income Energy Efficiency Housing Project demonstrated how energy efficiency interventions in low-income communities can help alleviate complex problems such as poverty, unemployment, and lack of environmental sustainability.
Between 1999 and 2010, Kuyasa’s investments in efficiency reduced energy consumption by 155 million kWh and CO2 emissions by 135,187 tons. At the same time, those efficiency activities led to the establishment of an industry spanning solar water heaters, ceiling insulation, and compact fluorescent lamps (CFLs). The Kuyasa project was budgeted at US$4.67 million and eventually registered with the United Nations Framework Convention on Climate Change (UNFCCC) as the first Clean Development Mechanism (CDM) project in South Africa.
The Kuyasa project installed a series of residential retrofits for low-income housing units to improve thermal performance. The project also provided energy-efficient lighting, improved water heating efficiency through solar water heaters, and improved thermal efficiency by installing insulated ceilings. Each housing unit included in the project received two CFLs, a solar water heater with a collector area of 1.4 square meters (15.07 square feet), and a hot water storage tank of 100 liters (22.7 gallons). Although the project covered the majority of the equipment and installation costs, participating households made small monthly payments to support their ownership of the upgrades.
In support of the local economy, South African contractors were invited to apply to participate in the program. The selected contractors, along with other local residents, received training on how to install the insulated ceilings, solar water heaters, and CFLs.
By 2010, energy efficiency retrofits for 2,309 houses in Kuyasa had been completed, and the project had created 87 local employment opportunities. Further evaluations suggested that nearly half of Kuyasa residents who had received technical skills training during this project had landed full-time jobs or business opportunities outside the community. In addition, all residents who participated in the program reported cost savings, the estimated sustained increase in household income was US$21 per month during the winter. Electricity savings alone amounted to approximately US$7 per month.
Energy Efficiency and Energy Supply Example
Utilities (and their customers) receive a number of benefits from implementing energy efficiency programs. For example, utilities that invest in energy efficiency avoid costs associated with producing more energy, including construction costs of new generation capacity and transmission and distribution networks. When power system expansions are avoided, utilities also avert potential costs to mitigate impact on the environment and vulnerable populations. Adding generation capacity comes with the risk that new customers and rising demand will cover the utility’s investment over time and produce revenue. Pursuing efficiency and lowering demand does not have this risk and can be managed to improve relationships with customers and save the utility money.
Energy efficiency reduces the electric load in specific locations. Utilities can avoid new or upgraded transmission and distribution infrastructure in these areas. The cost savings can be significant. The graph below shows how annual avoided costs in the U.S. can be as high as US$200 per kilowatt. Typically, energy efficiency is the least costly resource available to utilities, and energy efficiency can be deployed as an alternative to constructing new power plants or deferring transmission and distribution investments.
As a further disincentive to ever-expanding capacity, according to the U.S. Energy Information Administration (EIA), the cost of constructing new power plants has been increasing (see the graph below). Higher capital and other costs mean that energy efficiency programs which reduce peak demand and improve grid reliability can yield significant savings (or avoided costs) for utility systems. For example, across 36 U.S. companies reviewed in a study cited by an ACEEE report, some companies saved up to US$171 kilowatts per year, with average avoided transmission and distribution costs of US$48.37 over the course of three years.
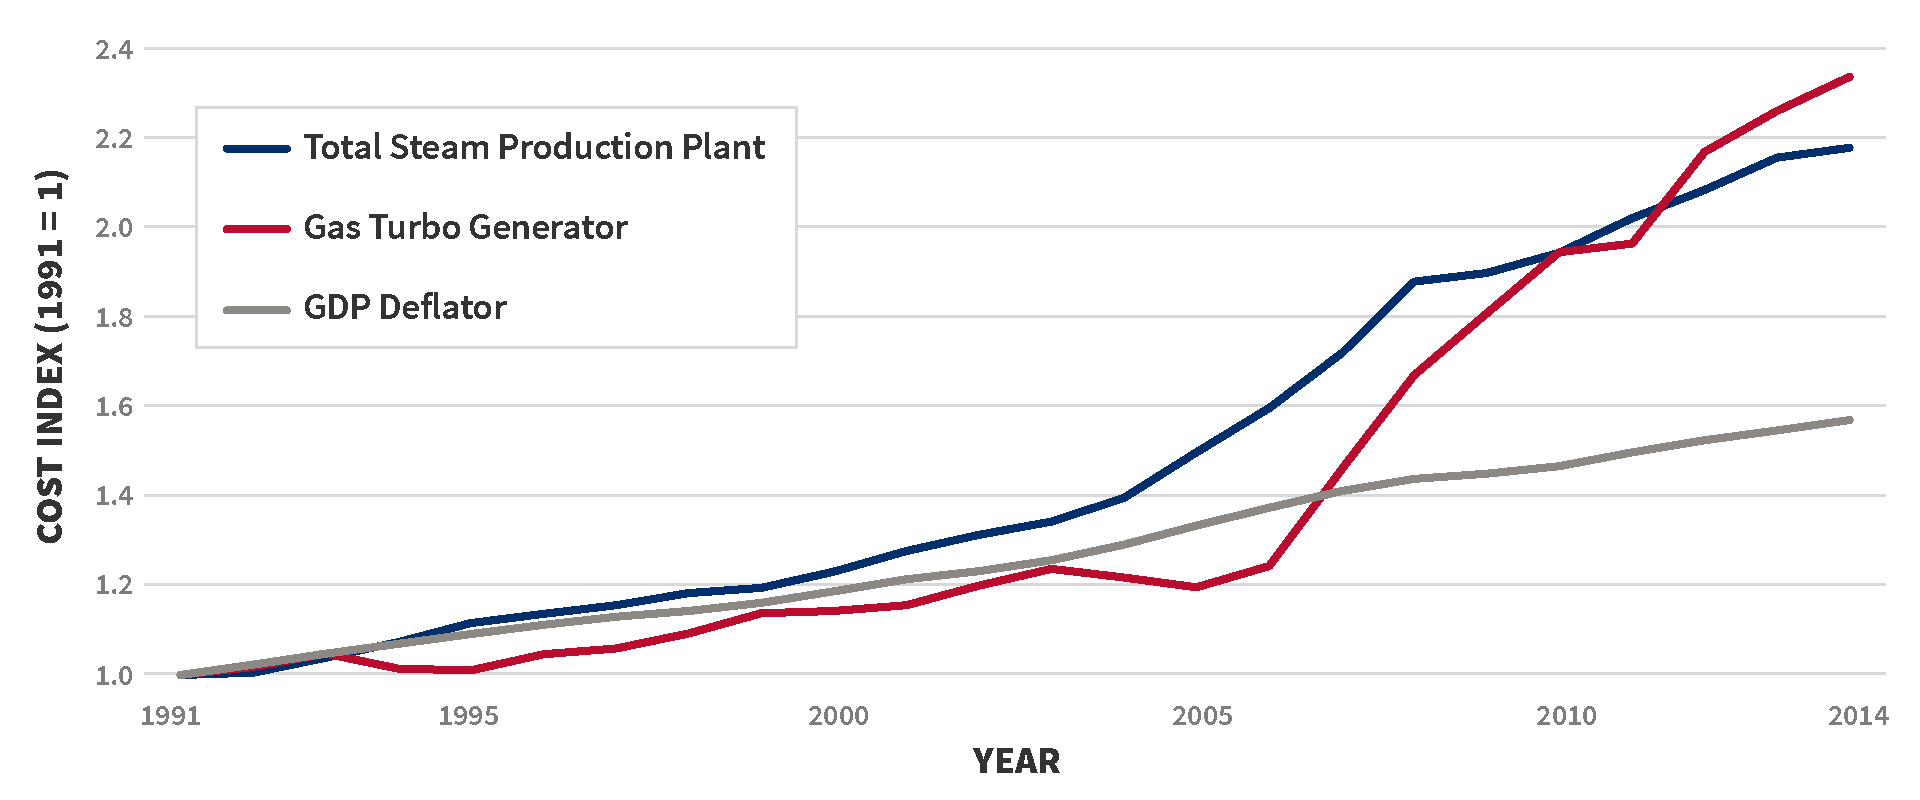
United States Bureau of Economic Analysis (2015). Current and Real GDP.
Comment
Make a general inquiry or suggest an improvement.