Speeches Shim

Improved Infection Control & Prevention

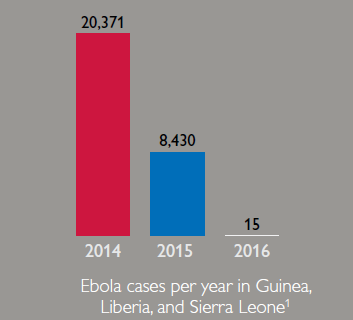
Donor and government messages that encouraged the public to adopt healthy measures filtered through radio and civil society organizations to communities. Significant declines in transmissions began in November 2014 as community involvement in combatting infections ramped up.
Restored Basic Health Services
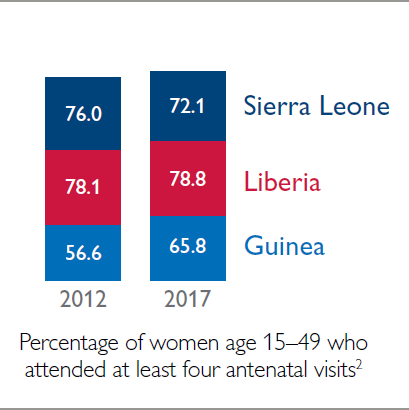
The number of antenatal care visits can be a good measurement for determining the health-seeking behavior of women. It also reflects the restoration of health services, clinical capacity, and trust in health facilities. Liberia and Sierra Leone recovered to pre-Ebola levels and Guinea surpassed them.
Upgraded Health Facilities
USAID helped rehabilitate facilities with basic lifesaving medical equipment, electricity, improved water sources, and safe methods to dispose of sharps. Increased access to safer sources of water is one way to measure the impact that sanitation programs achieved in the region.
Enhanced Service Quality

Increases in the percentage of live births attended by a skilled provider may indicate that quality improvements to health care services in West Africa after Ebola have begun to reinforce client desire for skilled care during births.
Restored Trust In Health Facilities
This indicator showcases the growth in health care consumption across West Africa that came when patients had revitalized trust in their local health facilities.
Increased Utilization In All Three Countries
The overall demand for health services also grew across West Africa after Ebola. This is reflected by the increase in outpatient clients.

Comment
Make a general inquiry or suggest an improvement.